SpaceTime™
Digital Twin of Earth | Discover actionable environmental insights and climate intelligence in a spatio-temporal format that is relevant to your business needs.
I am a frontend lead at Blue Sky Analytics, a climate-tech startup empowering the world’s decision-makers with accurate, real-time, and standardized climate data. Using AI models, we crunch terabytes of raw satellite data to deliver environmental and climate intelligence like forest fire risk, drought risk, GHG emissions from power plants, air-quality monitoring, and more.
To holistically understand and leverage these terabytes of data we need a visualization platform that allows users to get insights at their fingertips and is compatible with all types of devices. That’s where SpaceTime comes into the picture
What is SpaceTime™?
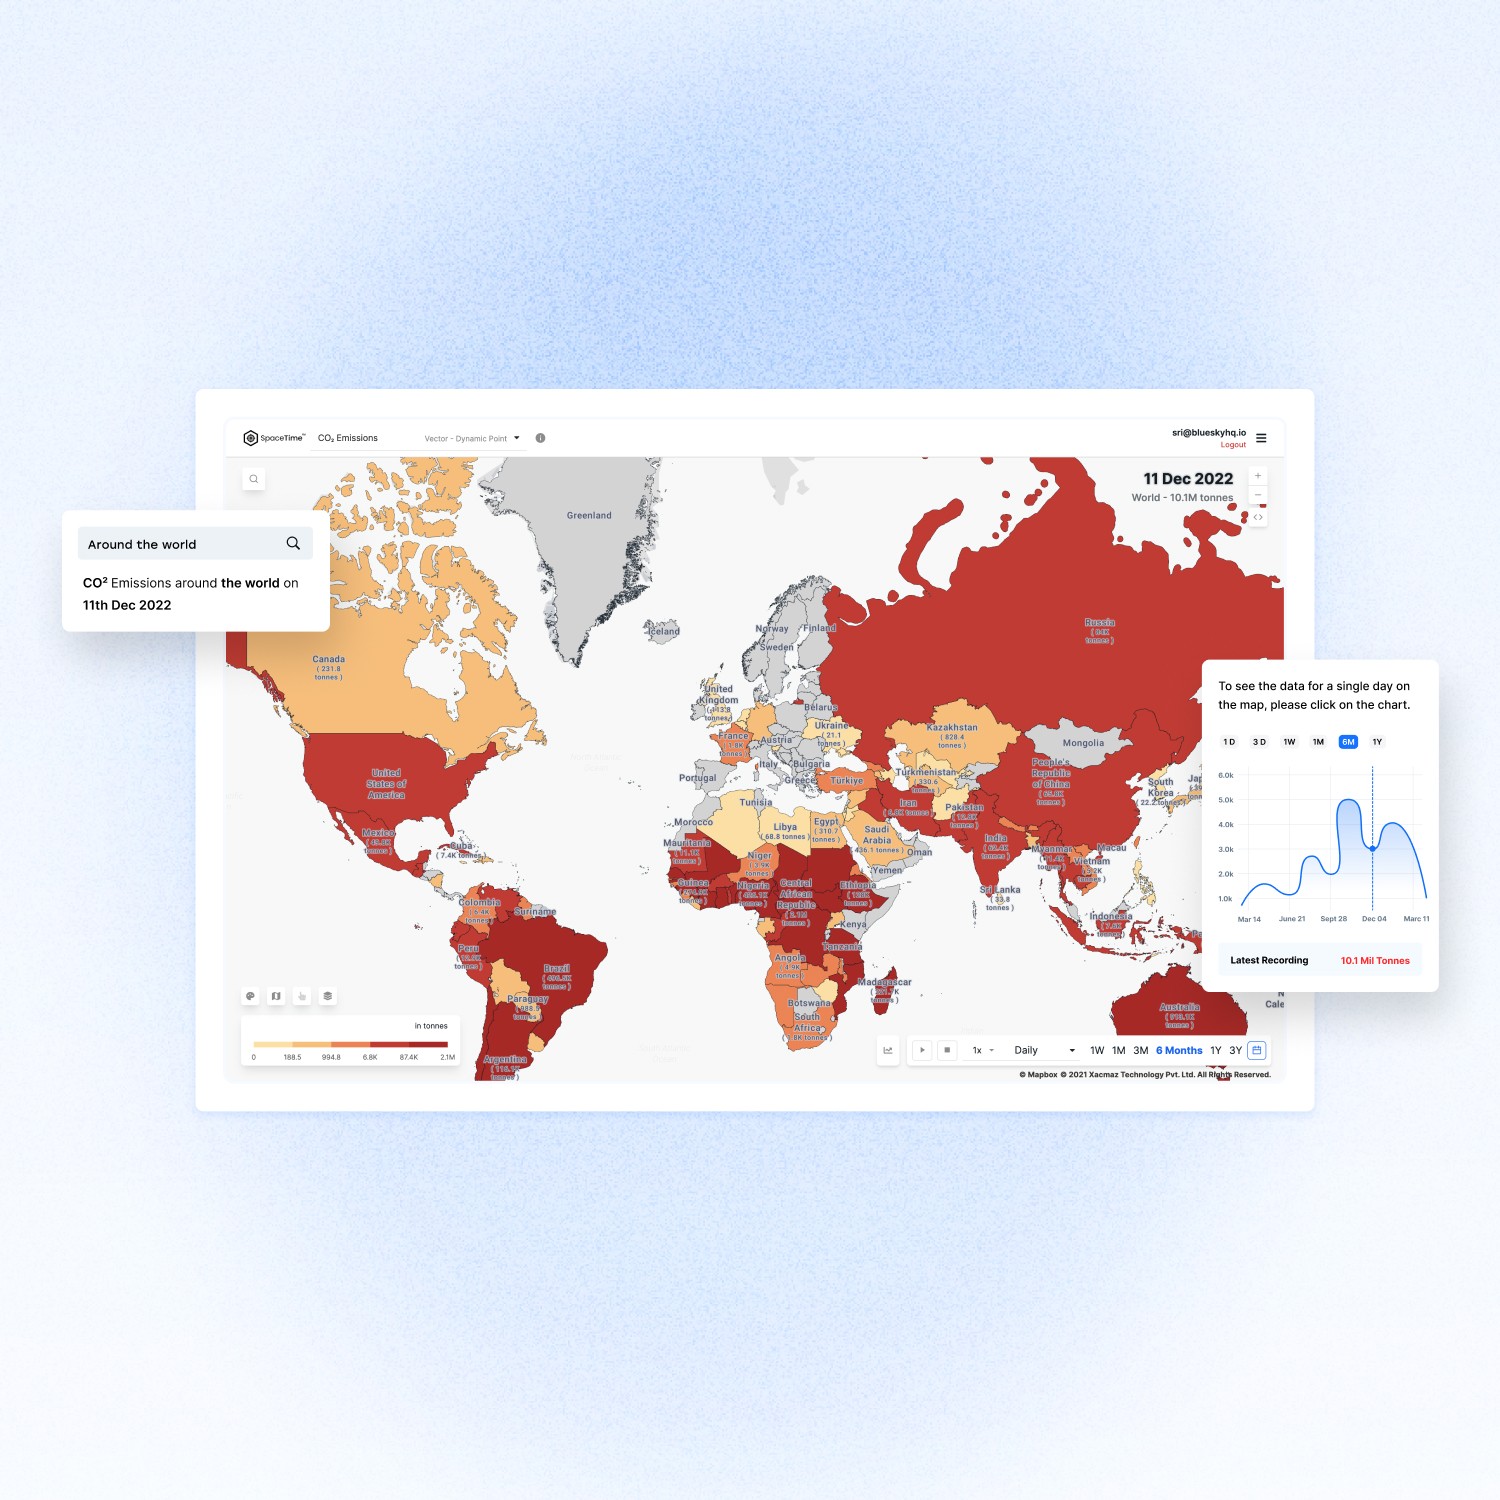
Tired of seeing endless maps and graphs? Meet SpaceTime™, A tool that blends both to provide a seamless, complete and multi-dimensional picture of Earth.
Inspired by Albert Einstein's Special Theory of Relativity, the name SpaceTime™ can be split into two parts: space and time, which respectively represent the spatial and temporal components of everything.
Imagine it as a Digital twin of the world for climate and environmental data, where you can move around in space & time to see the future, past, or present - just like a time machine.
Visualise diverse datasets, including vector and raster data, focusing on climate-change-related parameters generated by Blue Sky Analytics. Before diving deep into APIs, Visualize the available products, or configure and use Embed or export GIFs with a single click.


The main purpose of SpaceTime is to host all kinds of datasets like temporal & spatial - and primarily, the climate-change-centric datasets we generate in-house & deal with at Blue Sky Analytics. Interestingly, while the platform was developed with the aim to showcase customers and assist our sales, its potential use-cases to help communities have opened up a plethora of opportunities.
The platform is fully powered by WebGL and open source libraries like - Mapbox, D3, turf, dayjs, recharts, etc and we can visualize ANY spatial-temporal data directly to our browser without running any native application and it also inherits aspects of GIS. It is powered by two types of data sources I.e. vector and raster files. And comes with different data layers ranging from point, circle, symbols, cluster, polygons etc. The biggest advantage is that we can visualise the data using different colour scales like - min-max, quantize, quantize-nice & quantile and with the capability to customize colour palettes of your choice. In addition to that, it is easily compatible with mobile, desktop, and tablets on mobile networks and also accessible to colour blind people. Any dataset which has latitude, longitude (or a shape boundary) & timestamp can be visualised easily with a simple config JSON file.

SpaceTime allows us to make a set of configurations to generate different sets of spatial & temporal visualization and on each data config, we need to pass different components like - boundary level, parameters, duration, data type, data selection type, data mode, etc.
For eg - If you want to know all the forest fires that happened near the capital city of Greece in Athens over the period of 1 year
You can select the city boundary of Athens inside Greece’s country boundary
Check parameters of fires like - GHG emission, FRP or No. of fire counts
Select your durations, from 1 week to 3 year
Visualize it on basis of point/area/cluster/heatmap mode
Using all the amazing features we have already visualised many of our in-house datasets ranging from GHG emissions (dynamic point), water quality (raster), lake detection (polygon), air quality parameters like PM 2.5 (point & raster-based) etc.
That’s it! Within a few clicks & under 10 seconds, you can get these insights on your tablet, mobile, or desktop.